Veterinary nurses are frequently required to record electrocardiograms (ECGs). Some arrhythmias need quick recognition and action, and so a nurse that can assist is incredibly valuable. This article will discuss how to record a good quality ECG trace and how to minimise artifact interference. It will also describe the ‘normal’ ECG appearance and show how to interpret the recording using six simple step-by-step questions. It will also highlight and explain some of the more common arrhythmias seen.
Electrocardiogram (ECG) recordings can be quite daunting for the veterinary nurse to interpret. However, among the squiggly lines, there is an organized pattern of electrical conduction, which shows the depolarization and repolarization of the heart tissue via waveforms and intervals on the ECG (Willis, 2010). The technique of how to record an ECG trace is very important. The recording needs to be as clear as possible from artifacts, such as skeletal muscle movement or panting, because this may hide smaller parts of the ECG complex, which may hamper interpretation (Martin, 2007). A logical and systematic approach to ECG interpretation is recommended (Ware, 2007).
What is an ECG?
An ECG records the electrical activity (depolarization and repolarization) of the cardiac muscle, as it pumps blood around the body.
How to record an ECG
Correct positioning of the ECG leads is vital. If leads are misplaced, misdiagnosis may occur.
The correct positioning is as follows:
Red = right forelimb
Yellow = left forelimb
Green = left hindlimb
Black = right hindlimb
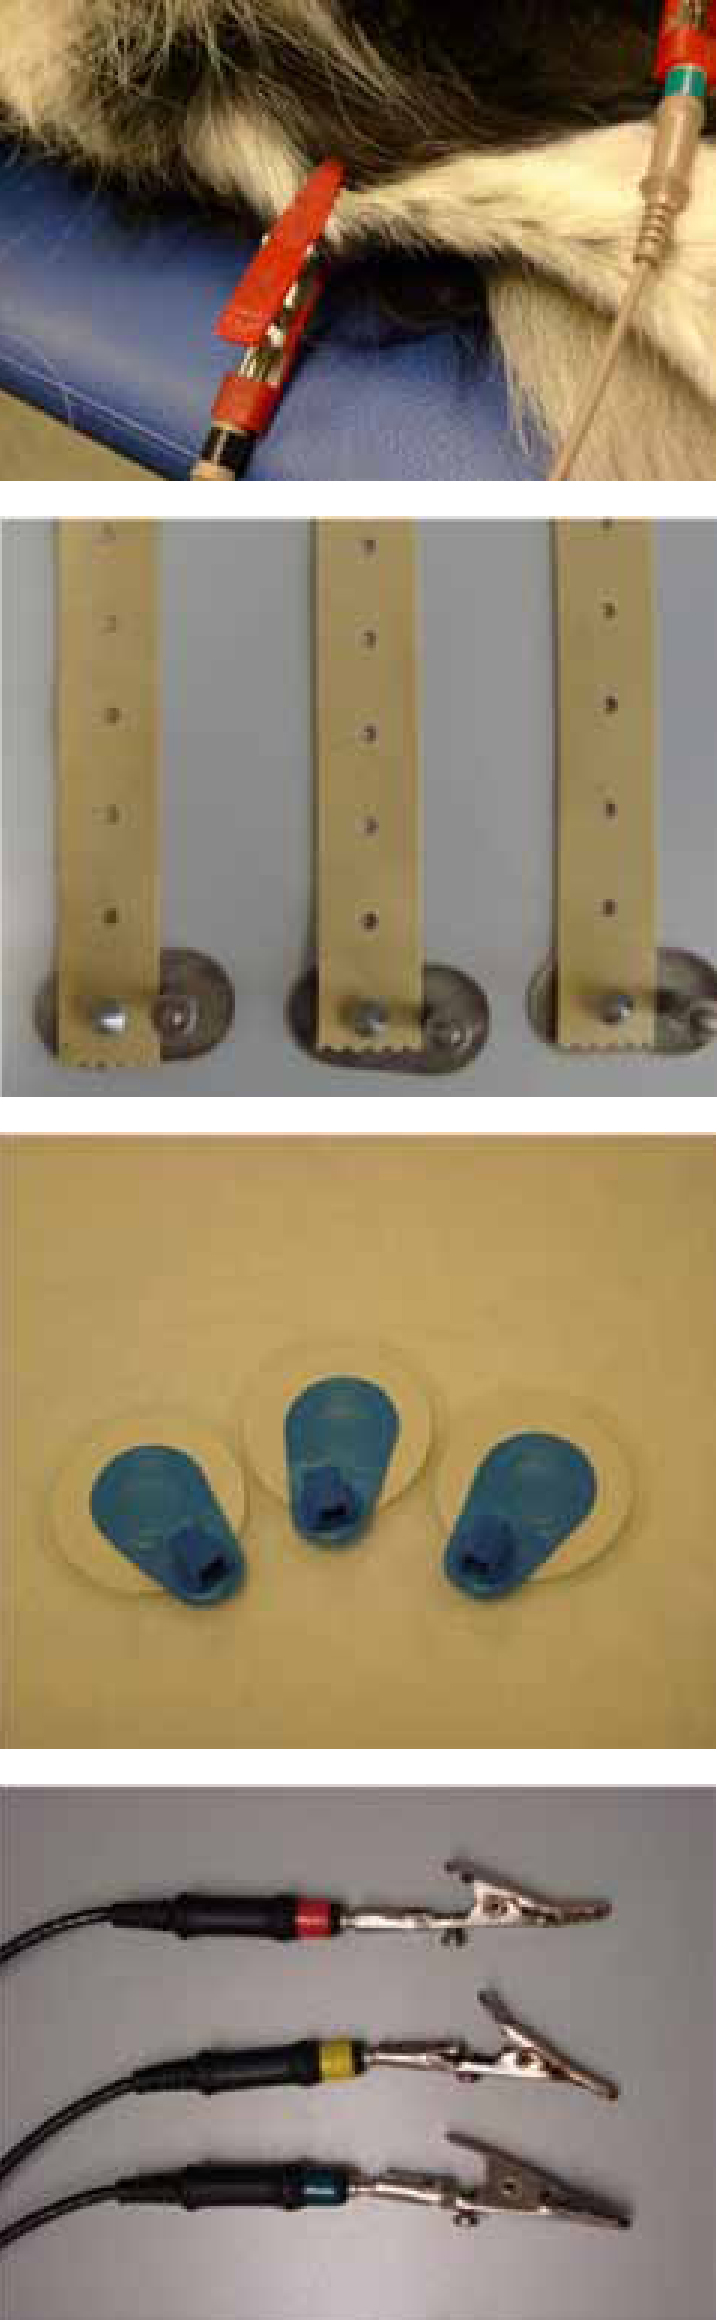
This colour coding is the most common placement of leads, but some machines can vary so check with each individual machine that this is correct. There are different types of ECG electrodes (Figure 1).
Figure 1. Different ECG electrodes available.
What is artifact?
Artifact is any interference that affects the baseline of the ECG recording. Common artifacts are respiration or limb tremors, movement, electrical interference or poor electrode contact. Simple ways to avoid this are:
Do not allow the leads to cross the thorax, which will prevent panting artifact
Steady the limbs to reduce movement. Try and keep the patient as calm and relaxed as possible and hold the legs apart so that they do not touch
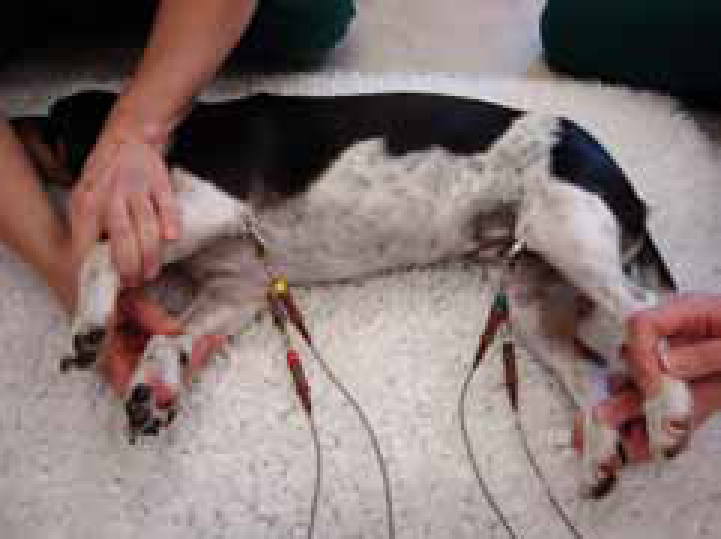
Lie the patient in right lateral recumbency on a thick vetbed or other insulated surface (Figure 2). If the patient is in respiratory distress, the ECG can be taken in sternal recumbency, but the veterinary surgeon must be notified
Ensure good electrode contact with the patient. Use a good amount of conductive gel
Switch off unnecessary electrical equipment, i.e. fans, clippers. Electrical interference can peoduce fine and rapid movements on the ECG baseline, which can hide parts of the ECG complex.
Figure 2. Correct positioning of patient and ECG leads.
The ‘normal’ — the sinus complex
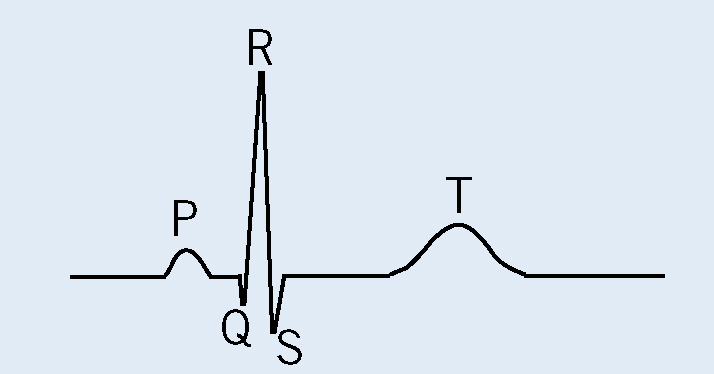
It is important to understand the different characteristics that make up the sinus complex. The sinus complex consists of a P wave, a QRS complex, which should be viewed as a whole entity, and a T wave. What this represents in real terms is depolarization and repolarization of the heart, shown as an electrical stimulus.
The P wave — the sinoatrial (SA) node starts the depolarization process and the impulse spreads from right to left across the atria. When the whole of the atria have depolarized, the electrical difference returns to baseline.
P-R interval — the atrioventricular (AV) node slowly conducts from the atria to the ventricles to allow co-ordinated ventricular contraction.
Q wave — this represents the depolarization of the ventricular septum.
R wave — the large muscle mass of the ventricles are depolarized through the His-Purkinje fibre network.
S wave — finally, the basal regions of the ventricles are depolarized.
T wave — repolarization of the ventricles. T wave morphology can vary largely from patient to patient, and therefore is of little diagnostic importance unless hyperkalaemia is a concern, and so biochemistry analysis should be undertaken in conjunction with the ECG findings (Figure 3).
Figure 3. The sinus complex.
Why does ECG interpretation matter?
Severe arrhythmias may result in haemodynamic compromise. Alternatively less severe arrhythmias can be an indicator for more severe arrhythmias or sudden death. Accurate interpretation of an ECG means that arrhythmias can be treated in an appropriate and timely manner.
There are three arrhythmias that are life threatening and require urgent attention — these are known as cardiac arrest rhythms (Dennis, 2010):
Ventricular standstill or asystole. These appear as having no QRS complexes, normal P waves
Pulseless electrical activity. This shows a bradyarrhythmia on screen, but no discernable pulses can be felt
Ventricular fibrillation. This is erratic in appearance due to irregular ventricular depolarizations.
Step-by-step guide
once a good quality trace has been obtained, a logical and systematic approach can then be employed to interpret the ECG.
To help with ECG analysis there are six basic questions that need to be asked:
What is the heart rate? Bradycardia? Normal? Tachycardia?
What is the rhythm? Regular? Regularly irregular? Irregular?
Is there a QRS complex for every P wave?
Is there a P wave for every QRS complex?
Are they consistently and reasonably related?
What is the morphology of the QRS complex? Narrow and upright or wide and bizarre?
This approach should be followed every time an ECG is interpreted, and practice will make this process a lot easier.
Heart rate
A lot of machines will record the HR automatically, however a quick method of calculating the HR is to measure a 6 second interval (15 cm at a paper speed of 25 mm/s or 30 cm at a paper speed of 50 mm/s), count the number of QRS complexes within this period and multiply by 10 to give the number of beats per minute. (Willis, 2010) (Table 1, Table 2).
Heart rhythm
A sinus rhythm is a normal heart rhythm where a P wave is consistently followed by a QRS-T complex. Sinus arrhythmia is regularly irregular, because it always has a P wave (although this may vary in amplitude), followed by a normal QRS complex, but the rate can vary (Table 3). It is associated with vagal tone and often corresponds with respiration, particularly in dogs. It is rarely seen in cats but occasionally can be seen in cases of upper respiratory tract obstruction or ethylene glycol poisoning.
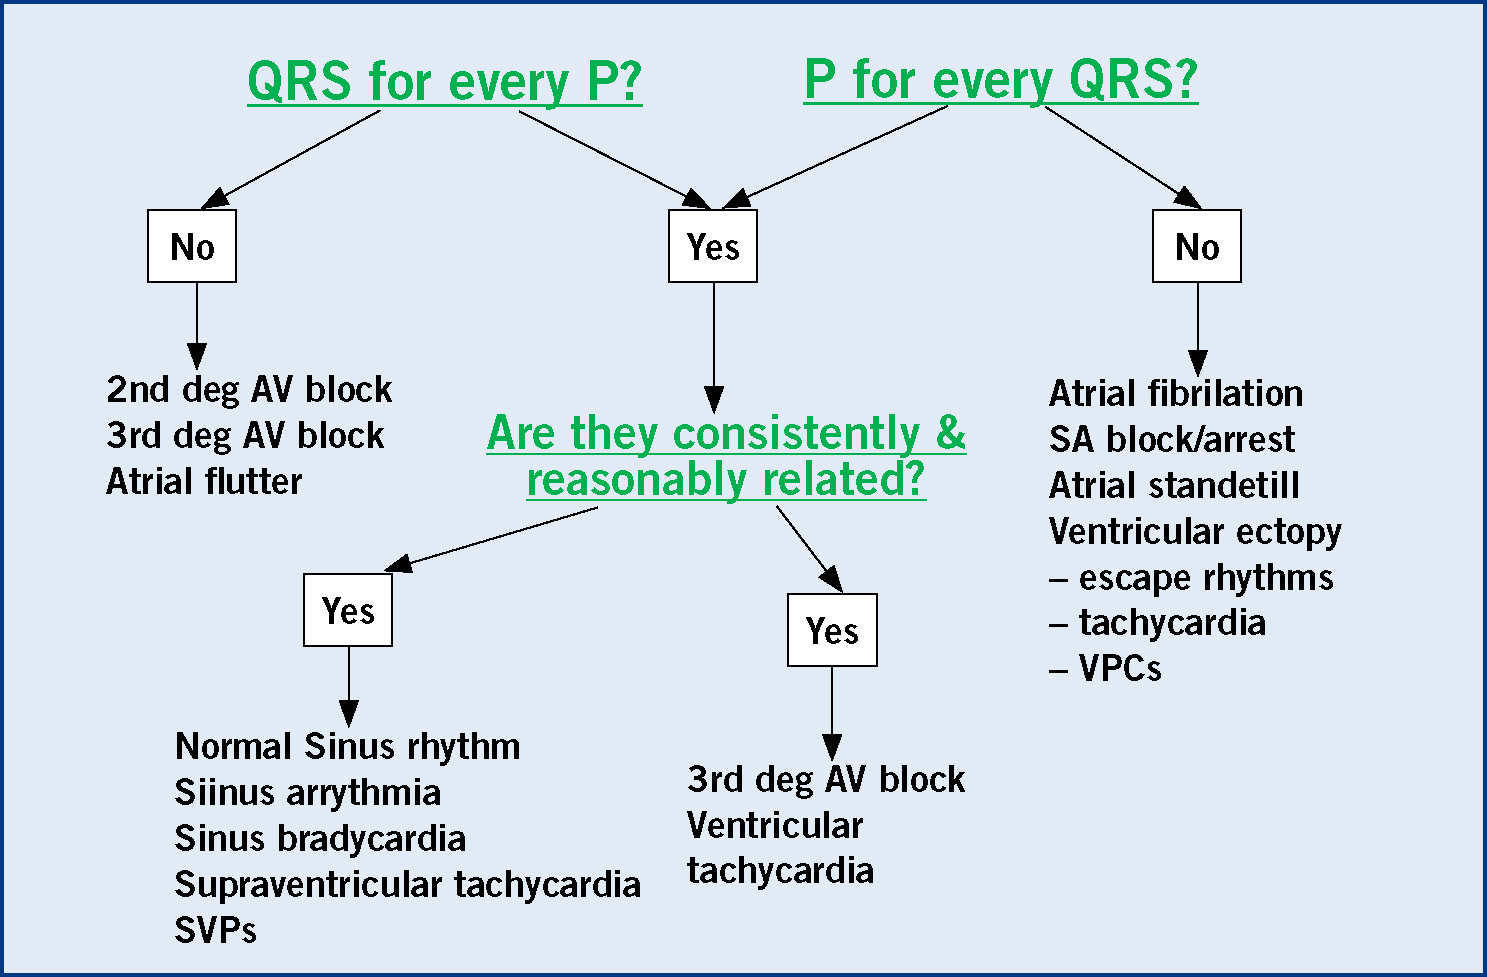
Assess P and QRS relationship
Every P wave should be followed by a QRS complex, and there should be a consistent relationship between them both at all times (Figure 4).
Morphology and QRS complex
If there are any normal sinus complexes examine them to determine what a normal complex should look like for that patient. If there is anything that does not look like a normal sinus complex, consider in what way it is abnormal. If it is narrow and upright then it will be predominantly atrial or supraventricular in origin, i.e. arising from above the ventricles – either in the atria, the atrioventricular junction or the bundle of His, or if it is wide and bizarre then it will be ventricular in origin.
Adult dog
70–160 bpm
Giant breeds
60–140 bpm
Toy breeds
70–180 bpm
Puppies
70–220 bpm
Adult cats
120–240 bpm
Bradycardia
Normal
Tachycardia
Sinus bradycardia
Sinus rhythm
Sinus tachycardia
Escape rhythms
Sinus arrhythmia
Atrial fibrillation/flutter
Atrioventricular block (AV block)
Atrial fibrillation
Ventricular tachycardia
Sinus arrest
AV block
Ventricular premature complexes (VPCs)
Atrial standstill
Ventricular premature complexes (VPCs)
Atrial premature complexes (APCs)
Atrial premature complexes (APCs)
Regular
Regularly irregular
Irregular
Normal sinus rhythm
Sinus arrhythmia
SA block/arrest
Sinus bradycardia
Fixed arrhythmias
Atrial standstill
– bigeminy
– trigeminy
Escape rhythms
2nd deg AV block
Atrial fibrillation/flutter
3rd deg AV blocks
SVPCs
VPCs
Sustained tachycardia
2nd deg AV block
– atrial
– ventricular
Figure 4. Showing how to assess P-QRS relationship.
There are some arrhythmias that need urgent treatment because they are haemodynamically unstable:
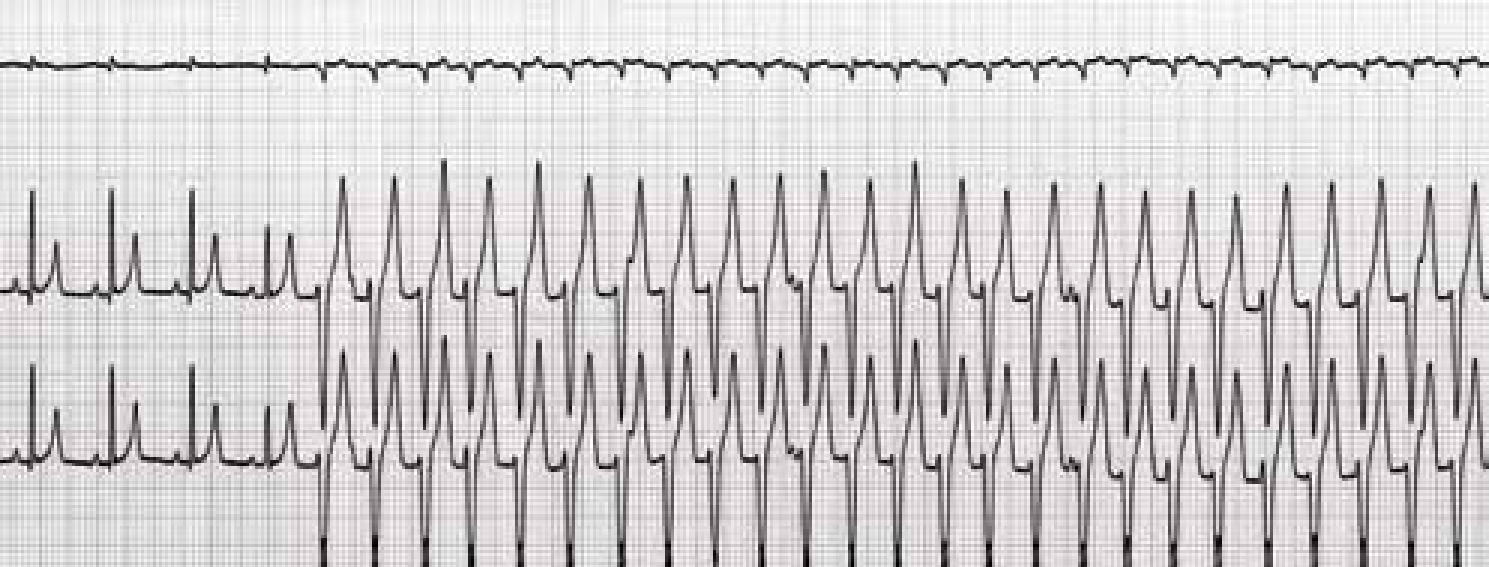
Ventricular tachycardias (Figure 5). These arrhythmias are unstable because they are either too fast for proper and organized ventricular contraction or they are firing from many different foci within the ventricles and have a varied appearance on ECG.
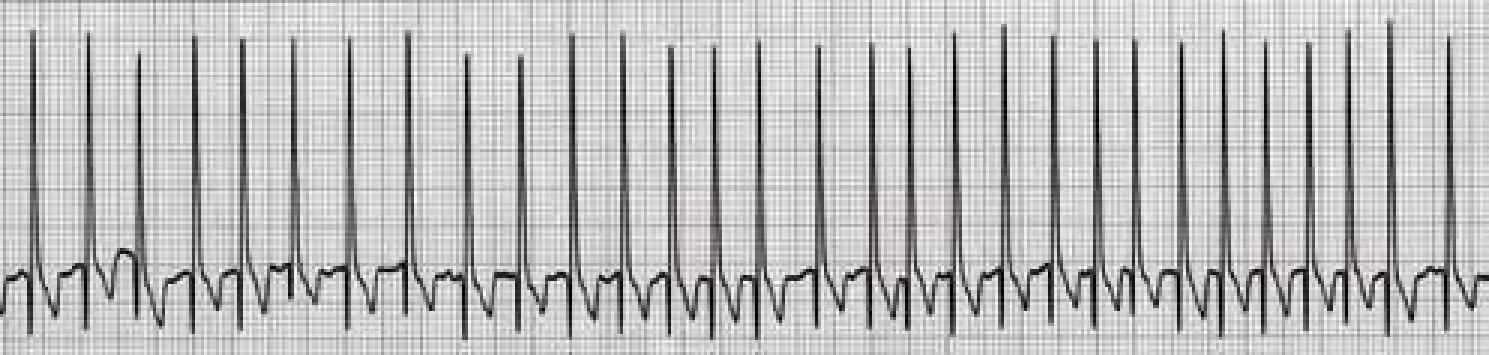
Supraventricular (or atrial) arrhythmias (Figure 6) These are usually associated with structural heart disease and are haemodynamically unstable when very fast (>250–300 beats/minute). These arrhythmias are life threatening when associated with heart failure
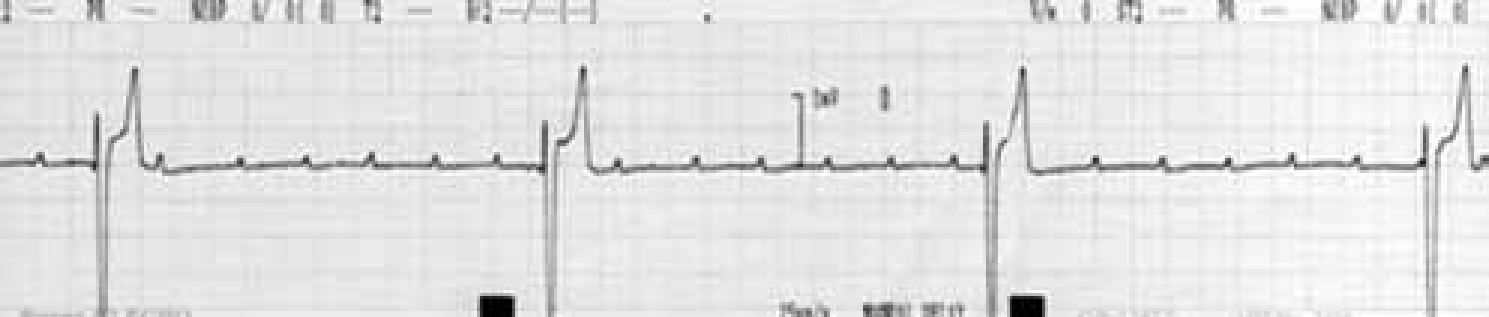
AV block — high grade AV block, either high grade 2nd or 3rd degree, can be potentially life-threatening because they can be haemodynamically and electrically unstable (Figure 7).
Figure 5. An example of a ventricular tachycardia. Complexes are wide and bizarre and have a regular appearance. A veterinary surgeon should be alerted to this arrhythmia urgently.Figure 6. An example of atrial fibrillation. Complexes are tall, narrow and irregular. The rate is approximately 240 beats/minute. Treatment is required fairly urgently.Figure 7. An example of third degree AV block. The rhythm appears quite regular, but the heart rate is very slow. Treatment such as pacemaker therapy is indicated fairly urgently.
Conclusion
The veterinary nurse is often in a position to record ECG traces. It is therefore important that correct technique is followed so that all traces are of good quality to save time and misdiagnosis. A nurse that can alert the veterinary surgeon to arrhythmias of clinical significance is exceedingly helpful to any practice, as well as making the job much more rewarding. With practice, the six questions can become part of a systematic and logical approach to ECG interpretation, which will make the ECG much less daunting.
Key Points
Ensure the ECG trace is of good quality and free from artefact
Calculate the heart rate. Decide whether the rate is slow, normal or fast.
Assess the appearance of the heart rhythm. Is it regular, regularly irregular, or irregular?
Evaluate the P:QRS relationship: is there a P wave for every QRS complex? Is there a QRS complex for every P wave? If so, are they consistently and reasonably related?